The air modeling is essentially a computer program designed to predict what impact an odor source, or group of odor sources, will have on an area based on a number of factors that are input into the program. The primary inputs include:
AERMOD is a comprehensive, steady state Gaussian plume dispersion model used for odor assessments as it assumes direct transport from a source to a receptor for every hour of meteorological data. It is designed to yield a conservative result in terms of odor impacts in the community surrounding the facility.
The modeling uses a full year of actual meteorological data, usually from the closest airport. The data includes the actual hourly meteorological data (wind speed, wind direction, temperature, cloud cover, ceiling height, and mixing height) from every hour of the year.
The information input into the model includes the Odor Emission Rates (OER) for each point source, odor source locations, discharge heights and size; the local meteorological conditions; and digital terrain data.
Modeling Output
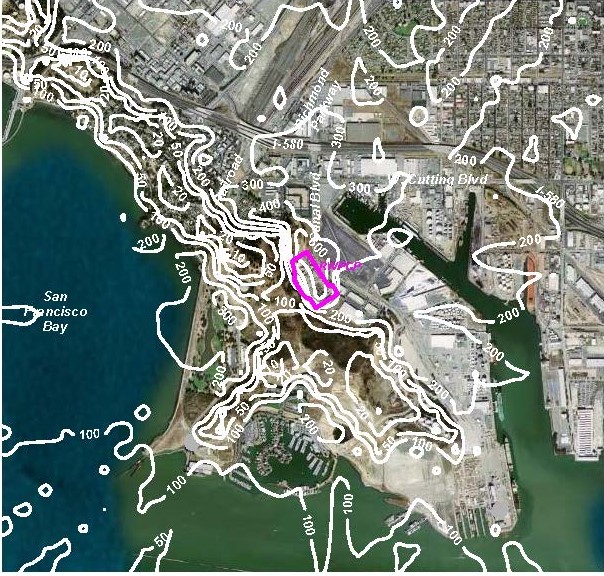
The model output predicts the highest odor level, estimated over the area of analysis. The resulting peak odor levels are shown graphically on odor contour plots as shown in these examples.
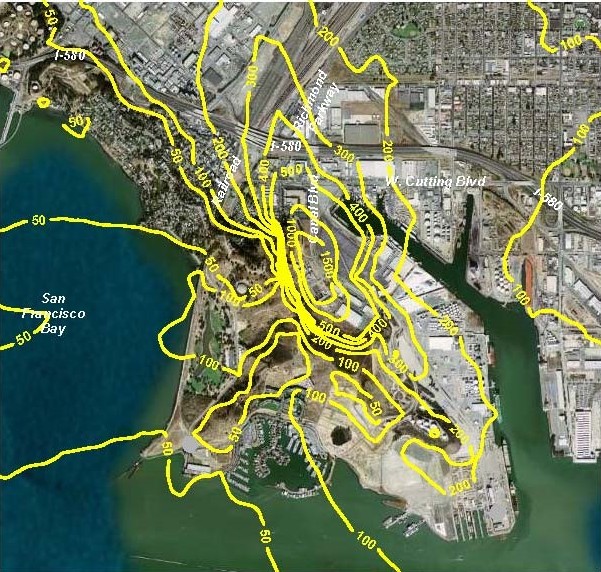
Another modeling routine is used to predict the frequency of odor events for the areas surrounding the facility. In other words, it predicts the number of times per year odors may be detectable at any point in the study area. For example, a person standing at a point where a frequency of 100 is predicted would be expected to experience an odor that exceeds the selected odor detection threshold approximately 100 hours per year.